Same Run Differential, Different Win Rate: Defining "Luck" with Pythagorean Expectation
I closed the last post with this question.
If run differential alone leaves something on the table, is there a better formula for win rate?
After confirming r = 0.95 across 5 seasons and 150 teams, we asked where the 5% above 0.95 was coming from. Two teams with the same run differential can end up with different win rates. A +50 from "winning 6–5 a lot" looks the same on paper as a +50 from "one 10–0 win and two 1–0 losses," but the win rates are different.
So if we take a formula that uses RS and RA separately — not just RS − RA — could it close that 5% gap?
It turns out the baseball stats world already has one.
Meet Bill James
In the 1980s, a night watchman at a pork-and-beans cannery in Lawrence, Kansas. Not on a team. Not in a stats department. Just a guy who liked baseball numbers.
His name is Bill James. He started self-publishing the Baseball Abstract in 1977, and over the years he basically rewired the way baseball is analyzed. Almost every modern stat you hear in a broadcast — OPS, WHIP, BABIP — descends from his work or the people he influenced. Billy Beane (yes, the Moneyball one) read Bill James and went on to run the Oakland A's that way.
One of his most famous discoveries is the topic of this post. Here's the form.
In words: square the runs scored, divide by (RS² + RA²). The result lands between 0 and 1, and James claimed it would be close to that team's actual win rate.
The name is fancy. Pythagorean Expectation. James himself joked that the formula's shape — squares on top and bottom — looked like a² + b² = c², and the name stuck.
Why Squared?
Anybody who sees this for the first time stops here. Why square RS and RA? Why not just use them?
Honestly, even James started with "I don't know why, but it fits." He tested the simpler ratio RS / (RS + RA), but it was always too gentle compared to actual win rates — it underestimated the good teams and overestimated the bad ones.
Pushing the exponent up to 2 — RS² / (RS² + RA²) — pulled the predictions further apart in both directions. Good teams got pushed up, bad teams got pushed down. That fit better.
Intuitive read: squaring magnifies large numbers and shrinks small ones in relative terms. A team with RS=900 and RA=600 (a 1.5× ratio) gets a simple-ratio score of about 0.6 but a Pythagorean score of 810,000 / (810,000 + 360,000) ≈ 0.69. That extra 0.09 captures something real about baseball: bigger run advantages come with disproportionately bigger win rates. It's nonlinear.
This formula isn't derived from anything. It's an empirical find — Bill James tried shapes until one fit. The name borrows from a Greek mathematician, but the spirit is "stare at the data and try things."
Plugging It Into 5 Seasons
The real question is whether this works on our data. So I pulled RS and RA for all 150 team-seasons in 2021–2025, computed the Pythagorean expected win rate for each, and put them on a scatter plot.
X-axis: Pythagorean expectation. Y-axis: actual win rate. Plus a y=x reference line. If a point sits exactly on that line, the formula nailed it.
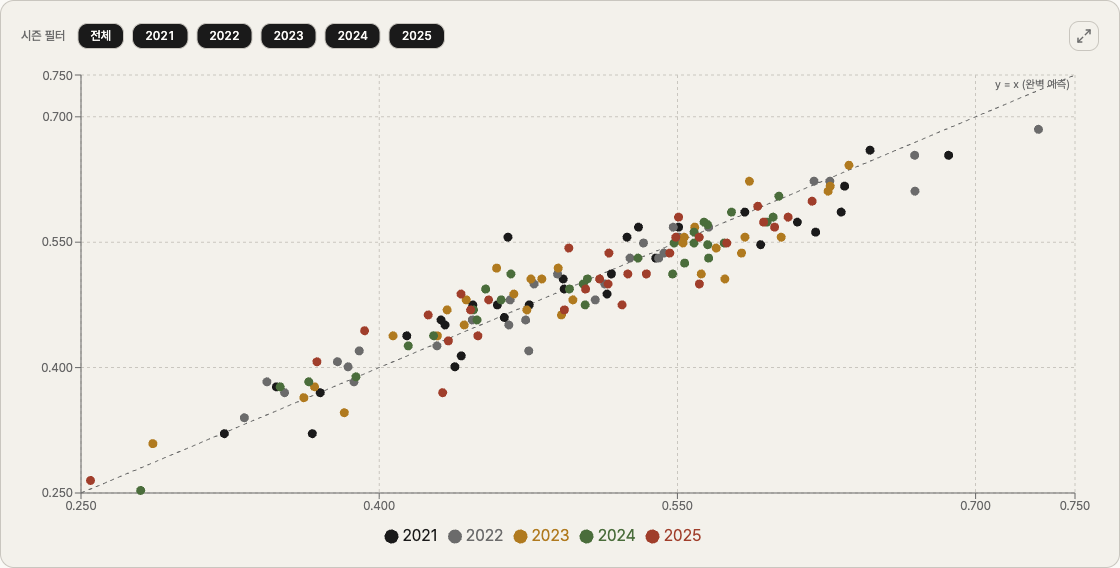
The eye answers before the math does. The cloud of points hugs the diagonal tightly. There's some scatter above and below, but very few points stray far.
And Yet… r Barely Moved
Let's get the number out of the way. In Q1, we got r(Diff, Pct) = 0.95. What does r(Pythagorean, Pct) look like?
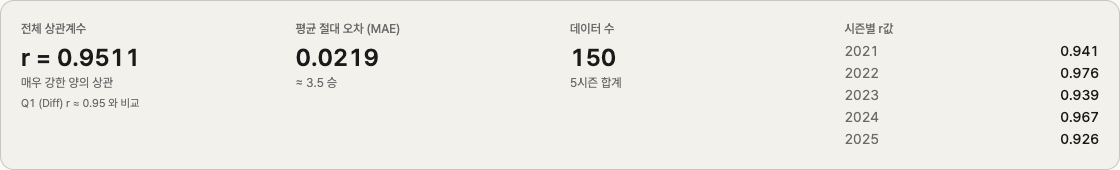
Across 150 points, r = 0.9511. Compared to Q1's 0.9503… that's a 0.0008 improvement. Practically nothing.
Honestly, it's a bit anticlimactic. We came in expecting "smarter formula → r jumps." Instead, a squared ratio barely beats simple subtraction.
Step back, though. r measures how much two variables move together. As we saw in Q1, run diff and win rate are tied together by definition. Hitting 0.95 already means "the linear relationship explains almost everything." Trying to squeeze more r out of a fancier formula is like trying to climb the last 10% of a mountain — you don't get many handholds left.
So is Pythagorean useless? No — we were just looking at the wrong number.
Forget r. Look at the Residual.
What Pythagorean actually gives us is a concrete predicted win rate per team. Q1's r = 0.95 was a one-line fact about a relationship; Pythagorean gives you, for every team, a number that says "based on RS and RA, this team should win about 58.4%."
Once you have a prediction, something natural follows: the residual.
Residual = actual win rate − Pythagorean expected win rate
Two teams with the same RS and RA might have residuals of +0.04 and −0.04. Same runs, same prevention, but they ended up 8 percentage points apart. Where did the gap come from? From everything the formula doesn't capture — how the runs were distributed across games, plus luck.
Phrased differently: we now have a way to split win rate into "what the formula explains" and "what it doesn't." That 5% gap from Q1 just got a name.
How Many Wins Off, On Average?
The next question writes itself.
How big is this miss, on average?
The standard tool is MAE (Mean Absolute Error) — average the absolute values of the residuals so positive and negative don't cancel out.
Across 5 seasons, MAE = 0.0219. That's in win-rate units, which is hard to feel. Convert it.
0.0219 × 162 games ≈ 3.55 wins
So Pythagorean is off by about 3.5 wins per team-season, on average. If the formula says a team "should win 85," reality usually lands somewhere between 81 and 89.
Is that a lot? In a 162-game season, 3.5 wins is roughly 2%. Meaning the formula explains about 98% of a team's win count. With just RS and RA, you can pin down a team's final wins to within ±3.
Earlier I said the r jump from 0.9503 to 0.9511 was anticlimactic. From this angle it isn't. Going from "they move together" to "RS and RA alone get you within ±3 wins" is a much stronger claim.
"Lucky" Teams and "Unlucky" Teams
The fun in residuals is who shows up at the top and bottom of the list.
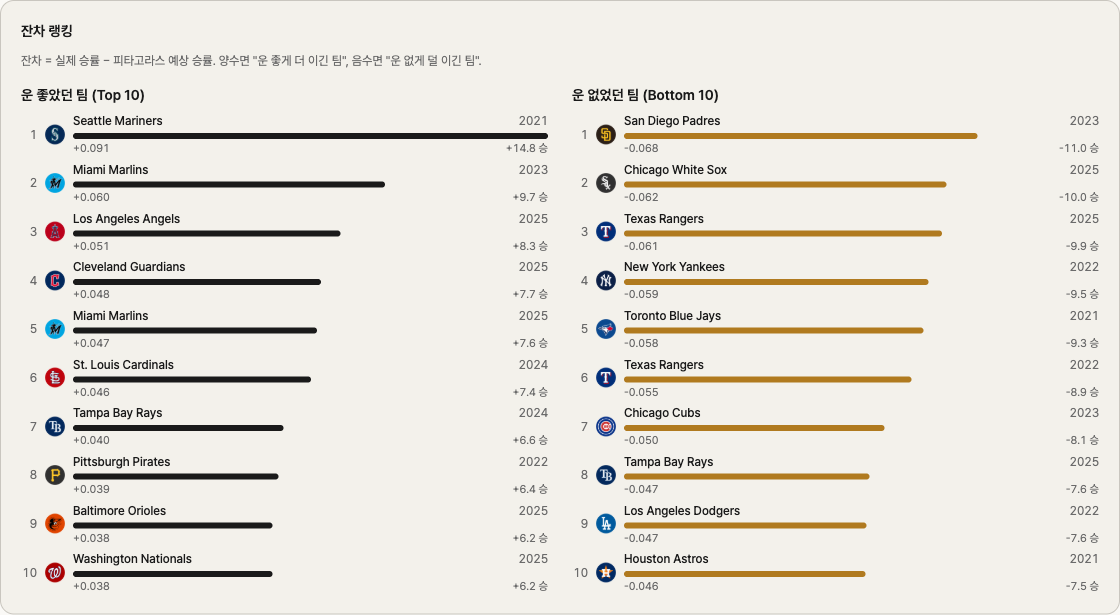
The team that outperformed Pythagorean the most (largest positive residual — "luckiest") across 5 seasons is a shock.
2021 Mariners: residual +0.091, about +14.8 wins
By RS and RA alone, the 2021 Mariners looked like a 46.5% team — call it 75 wins. They actually finished 90–72. Fifteen wins more than the formula expected. Mariners fans remember that season as "we kept winning every close game somehow." The numbers see it too.
On the other side, the team that underperformed Pythagorean the most is a name baseball fans will recognize.
2023 Padres: residual −0.068, about −11 wins
By RS and RA, the 2023 Padres were a 57.4% team — about 93 wins. They actually finished 82–80, missing the wild card entirely. This is the team that fielded Manny Machado, Juan Soto, and Xander Bogaerts in the same lineup — the consensus preseason favorite to come out of the NL, anointed "biggest disappointment of the year" by every postseason recap. The numbers confirm the gut feeling — they should have won 11 more.
The gap between the luckiest and unluckiest team is about 25 wins. Two teams with identical RS and RA can land that far apart.
Be Careful With the Word "Luck"
One honest caveat. A residual of +0.091 isn't all pure luck.
Stuff Pythagorean misses bundles together several things:
- Skill at winning close games: a great closer, clutch hitters, a sharp manager
- Injury timing: losing four starters in August vs. staying healthy
- Schedule strength: who you happened to play often
- Pure randomness: closing 14 one-run games at 9–5 vs. 7–7
Some of that is "skill" and some is "luck," and data alone can't separate them.
So instead of saying "this team got lucky," it's safer to say "this team has something the formula doesn't capture." If that something is real skill, the residual will stay positive next year. If it's luck, it'll regress. Telling those apart is a whole separate analysis.
Re-reading Q1
Loop back to Q1 for a second. We saw r = 0.95 and noted a 5% gap. We said "two teams with the same run diff can have different win rates."
After Pythagorean, that 5% looks sharper.
- Most of the 5% comes from "how the runs got distributed." Pythagorean catches that — it's exactly why r nudges from 0.9503 to 0.9511.
- A small slice still resists. That's the close-game stuff, injuries, schedule. About ±3.5 wins per season on average.
We took one lump and split it into two layers. The upper layer has a name now — "structure of how runs were distributed." The lower layer goes by, loosely, "luck."
This is a common move in data analysis. Something that looked like a single blob, with a sharper tool, turns out to have substructure.
The Next Question
One last suspicion. Bill James used 2 as the exponent. He said it came from trial and error — but is 2 really the best?
Some baseball analysts use 1.83 instead. Who's right?
Is 2.0 actually the right exponent? Can we find the real best from the data?
That's the next post. I'll sweep every exponent from 1.5 to 2.5 in 0.01 steps, find the one that minimizes MAE, and check whether the answer is the same every season.
This analysis was done with just-mlb, a tool I built. Look at the Q2 scatter and the residual ranking yourself, and find out whether your team has been "lucky" or "unlucky" by Pythagorean.